

Fill in the form below to access your FREE
2026 AI Infrastructure Market Report.
This Structure Research report maps the global AI-infrastructure build-out - a 66× scaling of critical IT capacity from ~2.3 GW to 150 GW by 2030 and resolves it through two questions: who pays for the silicon, and who runs the workloads?
Every figure is built bottom-up from Structure Research’s proprietary dataset - 14 per-company trackers plus a 38-operator neocloud and sovereign rollup.
Download the complimentary report here!
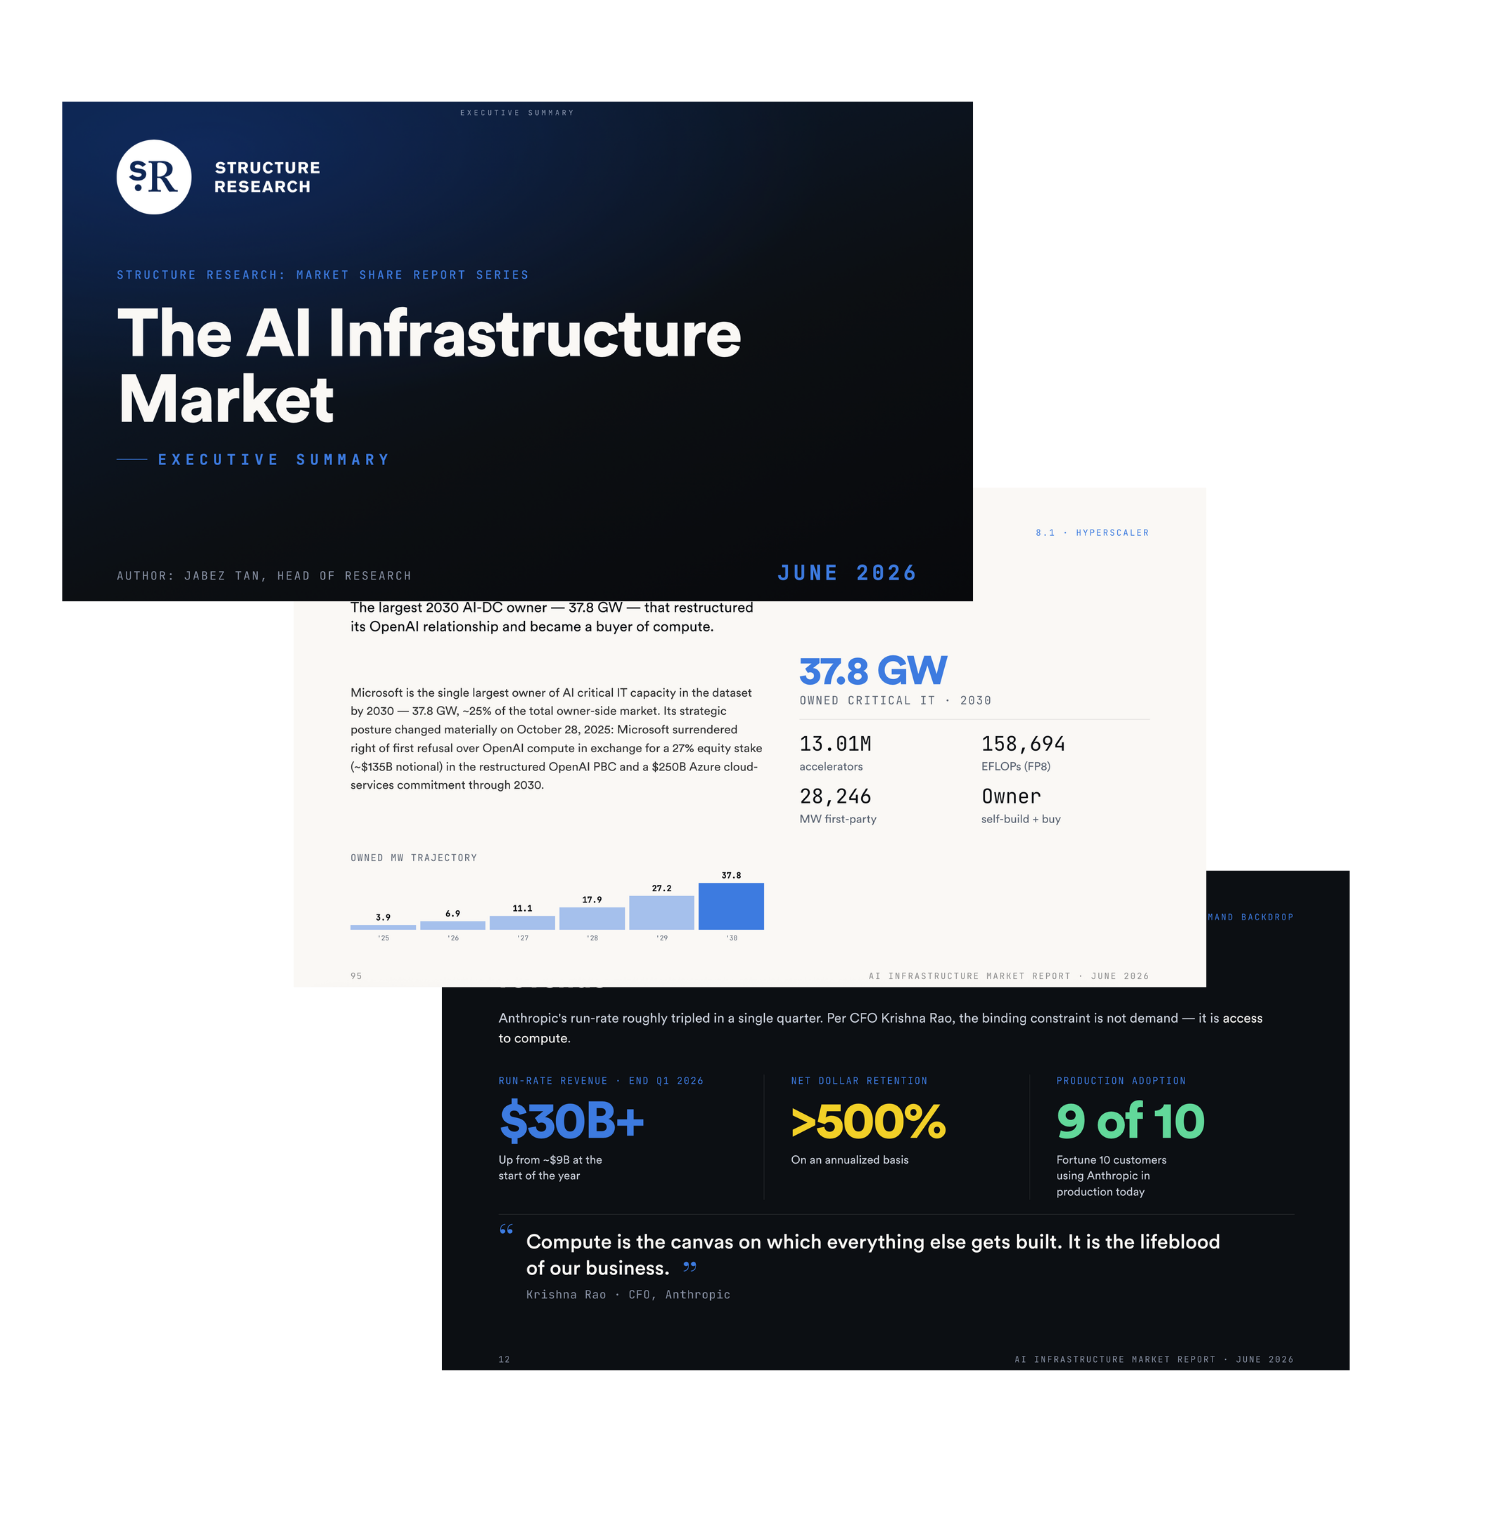
Executive Summary
This report maps the global AI-infrastructure build-out - a 66× scaling of critical IT capacity from ~2.3 GW to 150 GW by 2030 - and resolves it through two questions: who pays for the silicon, and who runs the workloads?
Every figure is built bottom-up from Structure Research’s proprietary dataset - 14 per-company trackers plus a 38-operator neocloud and sovereign rollup and held to a hard conservation constraint where owned capacity equals off taker capacity, so supplier-side and demand-side claims reconcile rather than double-count. The result is a single, consistent owner-versus-off taker view of where capacity, capital and compute actually concentrate.
What it addresses:
How fast, how large, and where the power wall binds
Who owns capacity versus who consumes it
Which deal structures convert capital into compute — a 45× range
How Microsoft’s pivot and the labs’ opposing playbooks reshape demand
Whether neoclouds, sovereigns and custom silicon hold or compress
Best Regards, The Structure Research Team